Hey hey!! Yo yo!! After preparing the pee looking LB broth the day before and having it autoclaved in an autoclave machine (something like a mini 121°C pressurized sauna) of course, we finally get to put the seed culture in.
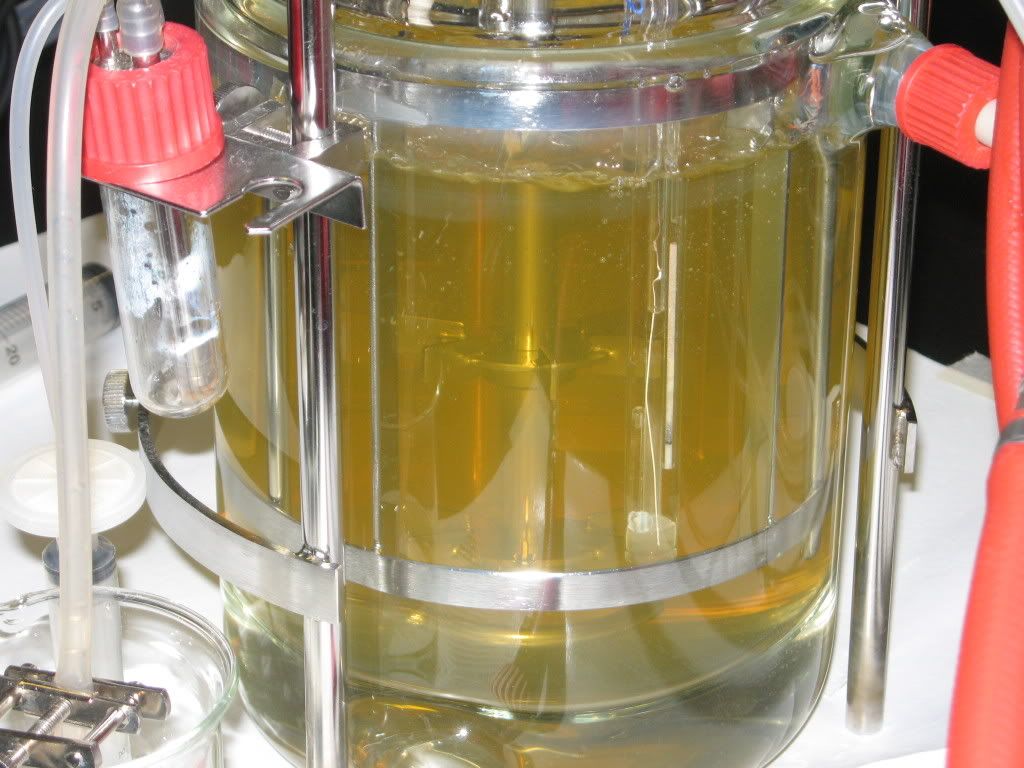 Tadah!! The fermenter with fresh autoclaved media…
 However, before putting in the seed culture, we added Ampicillin (an antibiotic) and Arabinose (an inducer) through the syringe. But why? Why do we need these 2 things?
Well... The E. coli that we used only became GFP E. coli after a plasmid vector was inserted. Basically, the vector that was used has Ampicillin (Amp) resistant gene and an Arabinose (Ara) inducer gene linked to the lux gene (GFP).
The Amp will prevent other bacteria from growing. The GFP E. coli can grow in the media as it has the Amp resistance gene. The Ara on the other hand will induce the formation of GFP in the E. coli (so that we can collect it for later!!).
After the addition of the Amp and Ara, we set up the control parameters of the fermenter as follows:
Temperature : 32°C (optimum for GFP folding and fluorescence)
pH : 7.5
Stirred speed : Min 10%, Max 90%. Control to AUTO
pO2 set point : Set point 20%. Control to AUTO
: Stir to CASC & Airflow to CASC
Airflow : Min 25%, Max 100%.
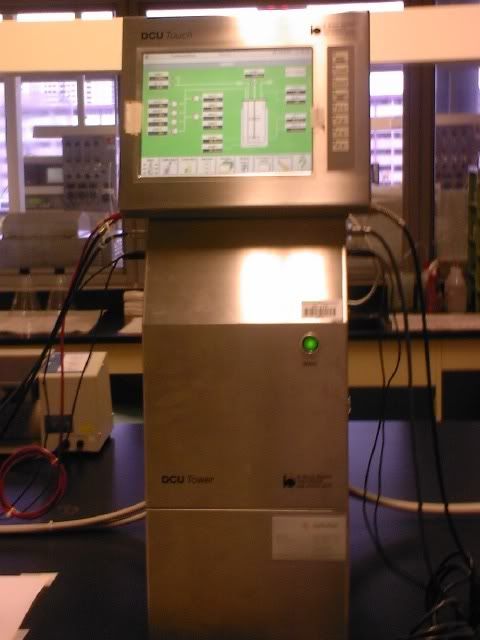 This is the control panel where we input the parameters.
Cheem looking machine right? Wires here and there.
Inoculation and Harvesting
After setting the parameters, 10ml of the media was taken out as a blank sample for the spectrophotometer reading later on.
The 100ml of seed culture was then inoculated to initiate the fermentation process.
The fermentation was continued for 24 hours before the harvesting step. For harvesting, 10ml of the fermentation broth was aliquoted out every hour into a sterile disposable test tube until we have 11 tubes of fermentation broth. The broth will be used to measure the absorbance at 600nm and from the graph obtained; we will be able to see the growth stage of the bacteria.
Anyways, this is the history chart of the fermenter.
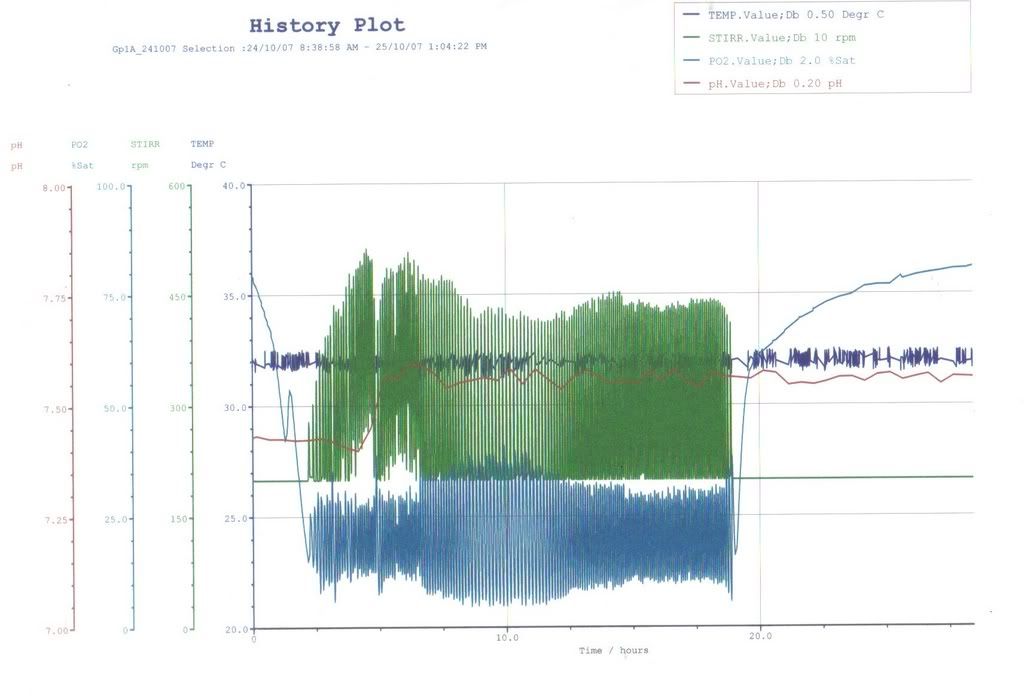 This is the one of the most complicated graph I have seen in my life... For now at least :P
Spectrophotometer
After getting the 11 tubes of fermentation broth, approximately 2ml of broth from each tube was transferred to a cuvette to measure their absorbance. After transferring the broth into the cuvettes (zzz…boring work), we measured the absorbance at 600nm. Starting from tube 1 (the blank), we zeroed the spectrophotometer and proceeded to measure the absorbance of each tubes (another boring job…Really slow la… Can only measure one by one…).
Well after slowly taking the absorbance ONE BY ONE, the readings were compiled into this table below. (We took the liberty of logging the values so that the graph plotted will look all pretty. Haha!)
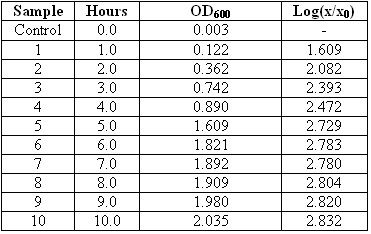 And this is how the graph looks like:
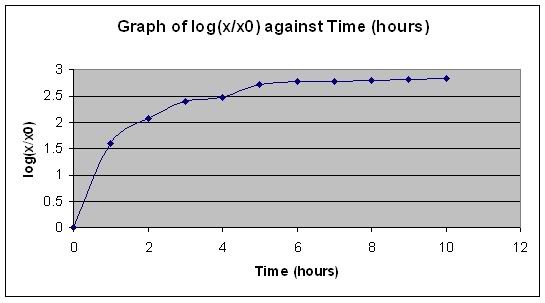 From here we can see that the growth phase is exiting from the exponential phase and entering the stationary phase. This is a good time to start harvesting the GFP as the bacteria will soon start entering the death phase (where all the cute little bacteria just die, die, die…Wah… evil sia…).
Well… That’s all I have to say for now!! See ya soon!!
~HaIKAN (You know.. This name really sux…)


No comments:
Post a Comment